Endoscopic Beta Probe
The goal of this project is to develop and test a new system (called Endoprobe) for use in radionuclide-guided endoscopic procedures. Endoprobe possesses the capability to acquire and display video from the endoscope's camera, project the position of the probe on a previously acquired medical image of the subject, and when desired, assess the amount of tumor-avid radiotracer present in selected tissues. Thus, the system should be capable of assisting in the identification of tissue areas that have a high likelihood of containing tumor prior to removal of a tissue biopsy sample. In addition to examinations of the esophagus, Endoprobe may also be incorporated with other minimally invasive procedures such as colonoscopies and laparoscopic surgeries
Instrumentation
Endoprobe has four major sub-systems: the beta particle detector (described in detail below), position tracker, endoscope and computer-user interface. The detector is designed to measure the amount of beta particles emitted from an area of interest. A position tracking unit will be used to monitor the position of the Endoprobe tip as it is inserted into the patient. The beta detector and position tracking system will be combined with a standard endoscope. Information from the beta detector and data from the tracking system, in addition to the video signal from a standard endoscope, will be input to a computer workstation for presentation to the endoscopist on a computer monitor. Thus, the fourth subsystem is the user interface used to acquire and combine data from the three sources (detector, tracker and endoscope) and display them on an computer-user interface screen.
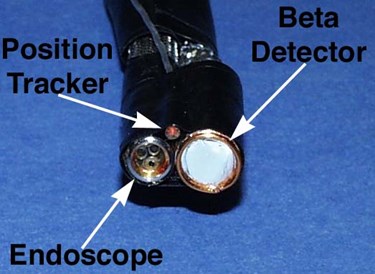
Endoprobe Tip
The tip of the Enodprobe system consists of the tip of an endoscope, a position sensor probe and the beta particle sensor. For initial testing, a non-clinical endoscope was used.
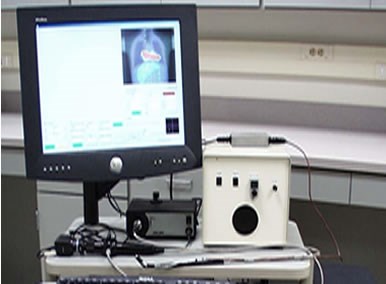
The complete Endoprobe system. All four system elements are shown: beta detector, position sensor, endoscope and computer interface.
Beta Particle Detector
As described above, the beta detector unit consists of two surface barrier detectors mounted back-to-back. Signals from each surface barrier detector are transmitted to charge-sensitive preamplifiers and from the preamplifiers to dual-stage shaping amplifiers via a shielded cable. These electronics are mounted in a small, sealed shielded box. The amplified signals are then transmitted to pulse-height discriminators located in the detector base station. The base station also houses an AC-to-DC converter to supply power to the detector electronics and bias voltage to the beta detector. An analog interface board (Model PCI-6025E; National Instruments, Corp.) mounted in the PCI bus of a personal computer (Dell Corp., Precision 650) is used to set user-determined lower threshold voltage reference levels utilized by the pulse-height discriminators. Transistor-Transistor Logic (TTL) pulses created by the discriminators are transmitted via a shielded multi-conductor ribbon cable to an event counting board (Model PCI-6602, National Instruments Corp.) resident in the personal computer. The count rate from the rear detector (detecting only photons) is subtracted from the count rate measured from the front detector (detecting both beta particles and photons) to produce a measurement of the pure beta signal emanating from the target area.
Position Tracker
A beta version of the Ascension Technology Corp. microBIRD position tracker was used to monitor the position and orientation in space (x, y and z coordinates, and azimuth, roll and elevation angles) of the Endoprobe tip. This information is continually displayed on the computer-user interface screen. The microBIRD system consists of two units, the receiver (which is attached the endoscope tip) and the transmitter (which is placed by the side of the subject). The receiver has a 0.9mm diameter. MicroBIRD utilizes DC magnetic fields, which means that no electronic noise is induced in the beta detector and interference caused by the presence of high purity stainless steel is minimal. The system has a positioning accuracy of <0.5mm and an angular accuracy of <1°. The sampling rate is 120Hz, so the position of the probe tip can be tracked in real-time.
Probe position is plotted by projecting a magenta-colored dot onto a previously acquired radiological image (PET, CT, MRI or multi-modality) of the subject displayed on the interface screen. A reference point is used to define a common coordinate system, allowing the position of the probe tip to be plotted on the image of the subject. In our experiment, a CT reference marker (2mm diameter steel ball) was placed on the phantom prior to scanning. During an Endoprobe procedure the probe tip is first positioned at the location of the marker. Then the computer-generated, magenta-colored dot relating the position of the probe tip is moved on the computer screen to coincide with the image of the CT reference marker. Movement of the dot is accomplished by interactively adjusting offset values added to the position tracker readings. At this point the actual position of the probe tip and position of the computer-generated dot are consistent. The cursor-offset values are then stored, and the reference point marked on the image with a red 'x'. Thus, the subject and the image of the subject now share a common reference point. All subsequent measurements of probe position plotted on the image are made relative to this point. Previously measured scale factors are used to convert the motion of the probe in the real space coordinate frame to motion of the computer-generated dot in the image space coordinate frame.
Endoscope
The beta detector and position tracker were attached to the tip of an endoscope (Figure 1). For this initial investigation we utilized a flexible two-way borescope (Model FF400, UXR, Inc.), which is a non-medical endoscope. The video signals from the endoscope's camera are captured using a high-speed video capture card (EPIX Corp., Model PIXCI SV5) mounted in a PCI slot of the personal computer. The capture rate of the card is 30fps, allowing real-time video display.
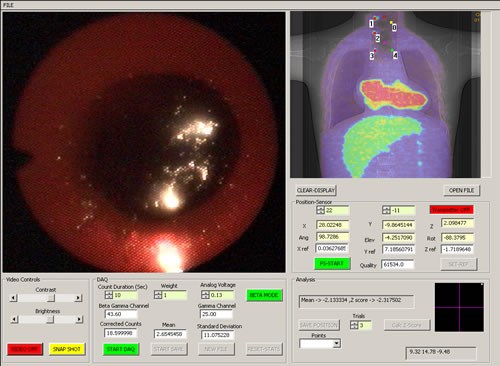
Endoprobe system interface screen (a fused PET-CT image is shown)
User Interface:
Once in the computer, the information from the sensors are processed and displayed on a computer-user interface screen shown above. The video image from the endoscope is continually updated in one window. As the Endoprobe tip is moved, its position in the patient is measured and projected on an image of the subject in real time in a second window. Thus, the position of the probe tip relative to anatomical landmarks (such as the sternum or heart) can be assessed if an anatomical image is used (CT or MRI for example), or its position relative to metabolically active areas suspicious for cancer can be assessed from a functional image (a PET image for example). Hence, the probe can be directed to potential areas of cancer previously detected with PET imaging. If a fused multi-modality image is used (PET-CT for example), anatomical as well as functional landmarks can be used to guide the probe. A traditional visual inspection for suspicious areas can also be performed if no abnormalities are observed on the functional image. When a radiation measurement is desired, the beta detector is placed in contact with the suspicious area and the beta flux measured by commencing a data acquisition. Controls for the beta detector unit, video capture system and position tracker are provided in a third window. The position of each radiation measurement is recorded and marked on the image of the subject. Video from the endoscope can be stored in compressed format for later replay. The user interface software was written using the Visual C++ Windows 2000 programming environment. The video from the endocsope can be captured to the hard drive in MPEG format for later viewing. Video can also be streamed in real time to a remote location.
The system has the capability to calculate the z-test statistic for individual beta measurements relative to a measurement made at a selected reference location, labeled Point 0. Point 0 is an area of known normal tissue (note that Point 0 is not the same as the coordinate reference point described earlier). If the magnitude of the z-test statistic is greater than 1.96 (representing a p-value of 0.025), a red dot is placed at the site of the measurement on the image (denoting an area of significantly increased radiotracer uptake compared to normal tissue); otherwise a green dot is placed at that location. Note that the z-test statistic threshold can be adjusted to specify any desired level of significance. Point 0 is marked with a yellow dot.
Testing
The potential capabilities of the Endoprobe system were explored by simulating the endoscopic examination of an esophagus containing radiotracer-avid areas of cancer (one of the intended uses for the system).
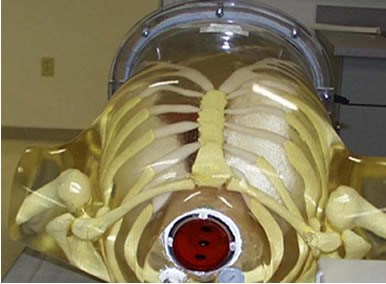
Anthropomorphic torso phantom used to simulate a patient with esophageal lesions; also shown is the transmitter for the position tracking system.
Phantom Tests
Endoprobe was tested in a simulated investigation of an esophagus for the presence of cancer with FDG. This application was chosen because the geometry of the esophagus is relatively simple to simulate and the search for esophageal cancer is one of the procedures that may most benefit from the use of this technology. Additionally, esophageal cancer is often diagnosed with endoscopy, and it has been reported to have good affinity for FDG. The torso of a patient one hour following administration of a 15mCi (555MBq) of FDG was simulated by filling the organs of a specially modified torso phantom (Radiology Support Devices, Inc.) with the appropriate amounts of FDG. The simulated liver, adipose tissue and myocardium of the phantom contained water with FDG concentrations of: 0.465microCi/ml (17.2kBq/ml) 0.160microCi/ml (5.9kBq/ml) and 1.069microCi/ml (39.5Bq/ml), respectively. The torso phantom was modified to create an esophagus. Specifically, an acrylic cylinder (5.5cm inner diameter) was mounted in the phantom’s throat region. FDG uptake in the surface of the esophagus was simulated by placing a gelatin film (1.5mm in thickness) containing 0.287microCi/ml (10.6kBq/ml) [Fukunaga T, Okazumi S, Koide Y, Isono K, Imazeki K. Evaluation of esophageal cancers using fluorine-18-fluorodeoxyglucose PET. J Nucl Med. 1998;39:1002-6] on the inner surface of the cylinder. Areas of the esophagus exhibiting increased FDG uptake were simulated with 12mm diameter disks of gelatin embedded in the gelatin film simulating normal esophagus. A sheet of thin plastic wrap was placed on the surface of the gelatin film to simulate the mucous layer lining the esophagus. FDG concentrations in the disks spanned the range for forty-eight malignant esophageal cancers measured using PET imaging by Fukunaga, et al. Specifically, the lowest FDG concentration used was 0.327mCi/ml (12.1kBq/ml), the median concentration was 1.29microCi/ml (47.7kBq/ml) and the highest concentration of FDG was 2.68microCi/ml (99.2kBq/ml). Fukunaga also reported that one benign esophageal tumor had an FDG concentration of 0.184microCi/ml (6.8kBq/ml). For each concentration, three disks were embedded at different positions in the gelatin film (a total of 12 disks) to simulate lesions at different depths in the esophagus (upper, mid and lower). Prior to examination with Endoprobe, the phantom was imaged in a General Electric CT scanner and a General Electric Advance PET scanner. The anterior-posterior (A-P) CT scout image was fused with the A-P projection PET image using visual landmarks for reference.
The tip of Endoprobe was then inserted into the simulated esophagus. First, areas of normal esophagus were identified with the video system. The gelatin simulating normal esophagus, benign and malignant diseases were colored (by adding food coloring to the gelatin) so that visual differentiation of the FDG concentrations was possible. Positron flux measurements were acquired at upper, mid and lower parts of the simulated normal esophagus. Point 0 was chosen to be the reading from the upper part of the normal esophagus. Next, simulated abnormal areas were identified visually with the aid of Endoprobe's video system; positron flux measurements were then acquired from these regions. In some cases positioning of the probe was confirmed by monitoring the probe’s position relative to areas of increased FDG accumulation identified on the PET-CT image. Each data acquisition consisted of three, 10 second counting periods. A total acquisition time of thirty seconds was judged to be the maximum desirable duration for clinical use. The user, however, can change the number and duration of each acquisition period via the interface screen. The mean and standard deviation of the three samples were calculated and displayed. All count rate data were decay corrected to the acquisition time of Point 0. Following the survey, the gelatin film simulating the esophagus was removed and the probe placed at the locations in the throat of the torso phantom previously defined as the upper, mid and lower esophagus. Count rate data were then acquired. These measurements were made to determine the count rate due solely to the background flux of annihilation photons caused by simulated FDG uptake in the organs in the body.
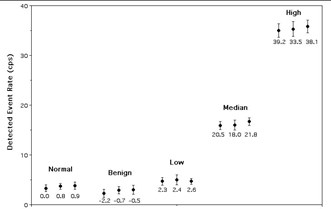
Results from the assessment of simulated esophageal lesions.
The figure above shows the results of the search for simulated areas of esophageal tumors. Measurements from the four different groups of simulated disease (one benign and three malignant) are labeled, as well as the normal esophagus. For each of these subgroups, three data points were acquired, one for each position in the esophagus (plotted left to right are data from upper, mid and lower esophageal regions). The z-test statistics calculated for each subgroup are shown below each point. There was good agreement between the visually-determined position of the high-concentration disks and the images of these disks seen on the PET-CT image. Note that only the high-concentration disks were observed in the PET image. It is important to note that areas of increased uptake simulating cancerous esophageal lesions were identified as having significantly greater levels of FDG (p<0.025) compared to simulated normal esophagus. It is significant to note that the simulated benign areas produced negative values of the test statistic due to the fact that Fukunaga et al. reported reduced FDG uptake in a benign lesion compared to normal esophageal uptake. Since this finding was based on data from a single lesion, it is uncertain whether reduced FDG uptake is indicative of benign disease processes or an anomaly in Fukunaga's study. Further work to clarify this issue is necessary. The fact that there were no significant differences in the data recorded for areas located at the upper, mid and lower esophageal regions indicates that the background subtraction technique is effectively rejecting signals produced by detection of background annihilation photons. If the correction system were not effective, there would be a correlation between probe location and count rate, because as the probe progresses deeper into the phantom, annihilation photon flux increases (mostly due to the high amount of FDG present in the heart phantom).
Beta Detector Unit (Design & Testing)
The Endoprobe detector unit consists of two surface barrier detector wafers mounted back-to-back in a stacked configuration. The back-to-back arrangement allowed the wafers to share a common ground connection; creating a compact unit. Since the detector unit is intended for eventual combination with endoscopes, its physical dimensions must be as small as possible. Indeed, the major dimensional restriction was the diameter of the detectors. It was this parameter that had the most significant effect on the choice of solid-state detector. Ion-implanted silicon detectors (IISD), such as those used in the handheld intraoperative probe, require an approximately 2mm thick passivation ring around the active area of the wafer. Thus, the diameter of the wafer is significantly larger than the active area of the detector. For example, the 8mm diameter active area of the IISD unit used in our handheld probe has a total diameter of 12mm. The large passivation ring is critical to the design of IISDs; therefore the diameter of small active area detectors will be significantly larger than the active area. Hence, based on size considerations, the utilization of IISDs was considered non-optimal for this miniature detector system. Instead, surface barrier detectors were used. These semiconductor devices have relatively low noise and good beta detection sensitivity, while possessing low photon detection sensitivity. In addition, these detectors do not require thick passivation rings, thus the dual detector unit could be made to be compact. Each surface barrier detector had a 0.5mm thick depletion layer and 3mm-diameter active area. The detectors were separated by 0.5mm and mounted in a small PC board frame by AMETEK, Inc. A thin copper plate separating the two detectors was used as a common ground contact that also absorbed any positron not absorbed in the front detector. Thin (1.5mil) pieces of polyvinyl fluoride film (Tedlar; Dupont Films, Inc.) were mounted on both open ends of the unit to protect the front and rear detector faces. The unit has a total diameter of approximately 5.6mm.
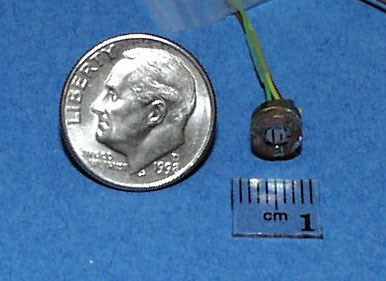
Endoprobe Beta Detector Unit
The electronics for preamplification and amplification of the event pulses from each of the two detector channels were housed in a small shielded box located close to the unit to reduce noise due to the capacitance of the cabling. The initial stage of each channel consisted of a Micro Hybrids, Inc. MHI1216 charge-coupled preamplifier. Preamplified pulses were amplified and shaped (shaping time= 0.3ms) with a dual-stage amplifier designed specifically for this application.
The resolution of the system is 3.05mm. The beta particle detection sensitivity is 1.87cps/nCi of F-18 (1870cps/uCi), the photon detection sensitivity is 0.0048cps/nCi of F-18 (0.12cps/uCi).
Two-dimensional point spread function of the system (FWHM= 3.05mm).
Plot of detector count rate versus activity, the plot was fit to a straight line; the slope of this line is the beta detection sensitivity.
The project is current on hiatus. We are seeking translation opportunities to continue testing and commercialization efforts
Acknowledgements
This work was supported by a grant from the National Cancer Institute and the National Institute of Biomedical Imaging and Bioengineering (R21 EB002140).