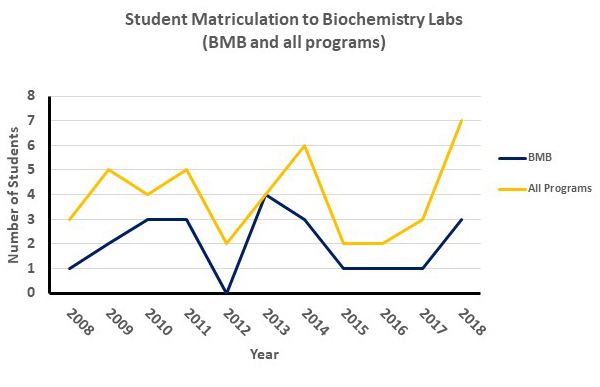
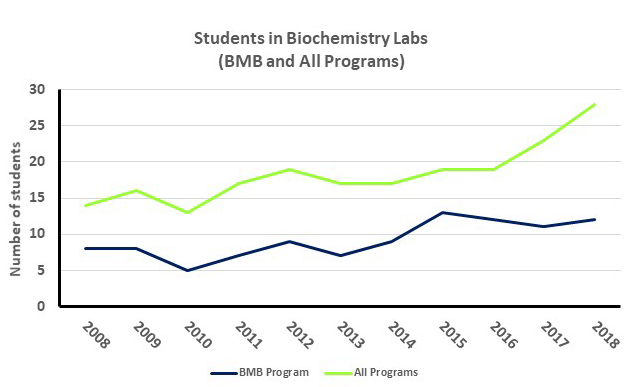
The graph above shows number of students who have matriculated to Biochemistry labs. The number of students joining the BMB (Biochemistry and Molecular Biology) program and all programs are shown. In 2018, 7 students joined Biochemistry labs and 3 of these students joined the BMB program.This graph shows the number of students in Biochemistry labs, both in the BMB (Biochemistry and Molecular Biology) program, and in all programs. In 2018, there were approximately 28 students in Biochemistry labs, and 12 of those were in the BMB Program.
Student Demographics
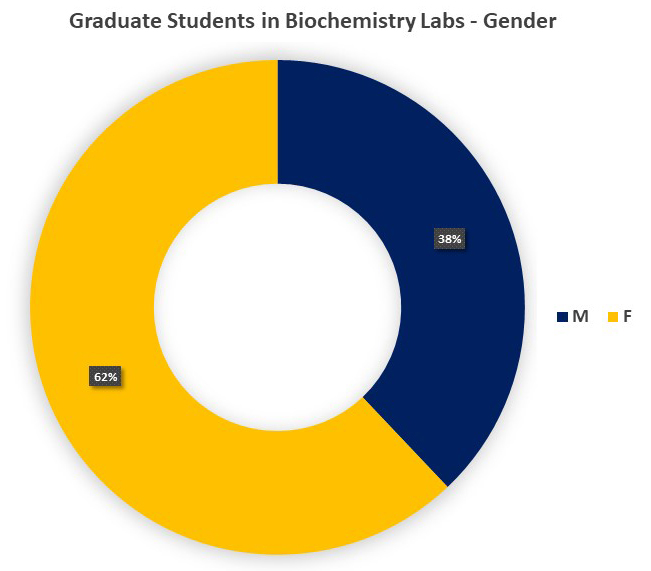
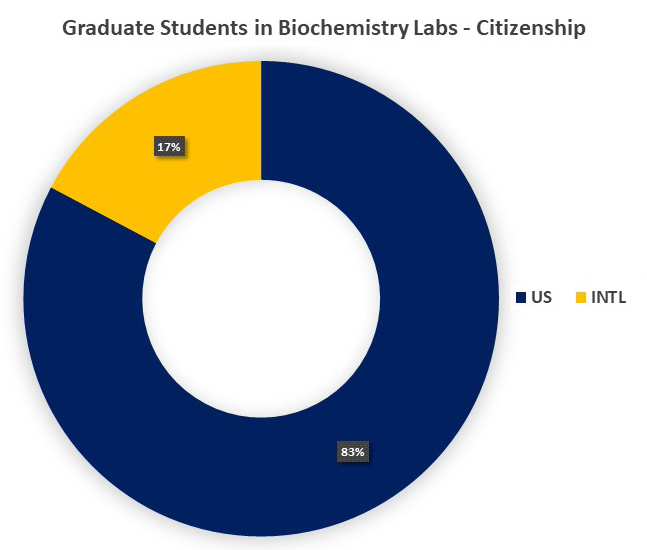
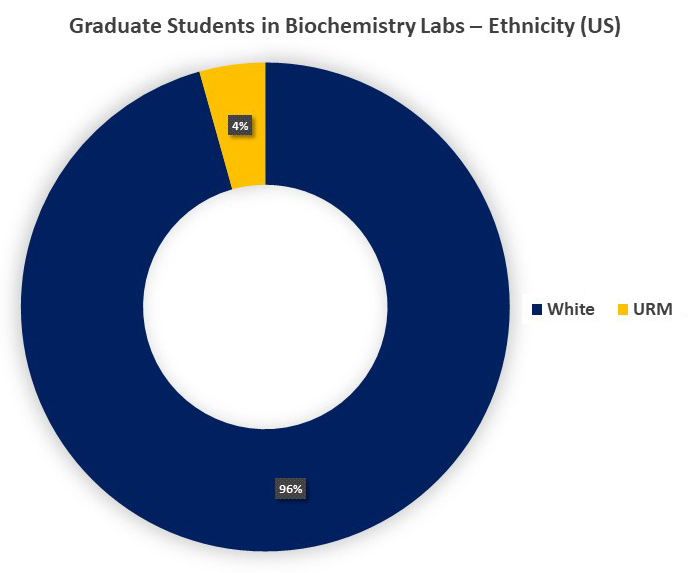
The graph above shows the percentage of students in Biochemistry labs by gender. Males make up 38% and females make up 62%.The graph above shows the percentage of students in Biochemistry labs by citizenship. US students make up 83% and international students make up 17%The graph above shows the percentage of students in Biochemistry labs by ethnicity. White students make up 96% whereas underrepresented minority (URM) students make up 4%
Retention
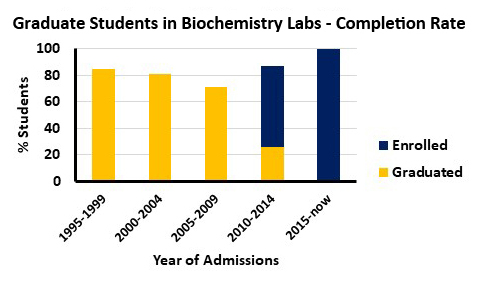
This graph shows the percentage of students in Biochemistry labs who have enrolled or graduated based on their year of admission. Typically, greater than 80% of enrolled students complete their degree.
Time To Degree
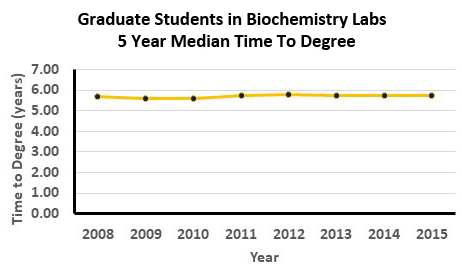
The graph above shows the 5 year median time to degree. As you can see from the graph, the average time to degree is less than 6 years.
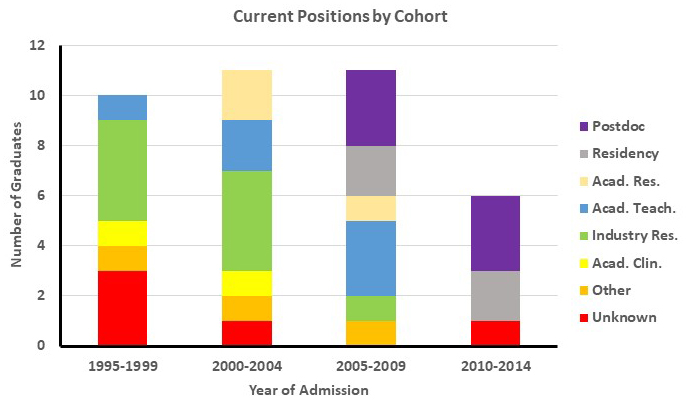
Outcomes
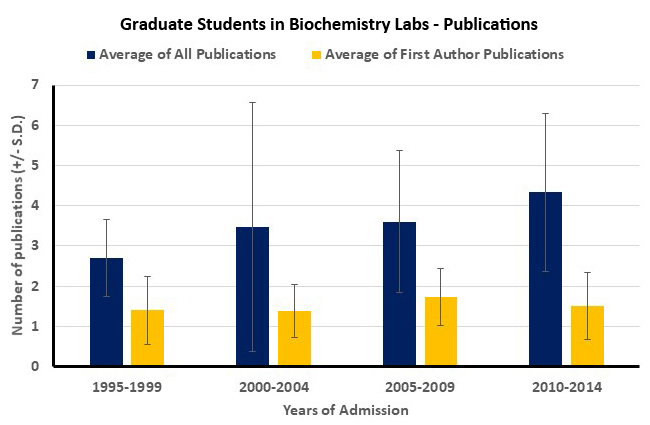
The graph above shows the average number of publications from students in Biochemistry labs. As you can see for example in the 2010-2014 period, students averaged 1.5 first author publications and more then 4 total publications.This graph illustrates the current position of our graduates. Our most recent graduates are post-docs or residents. Graduates from our program are also in academic research, industry research, and academic teaching.