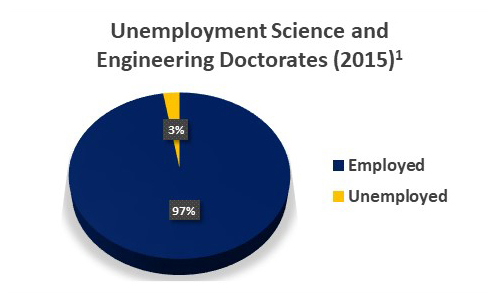
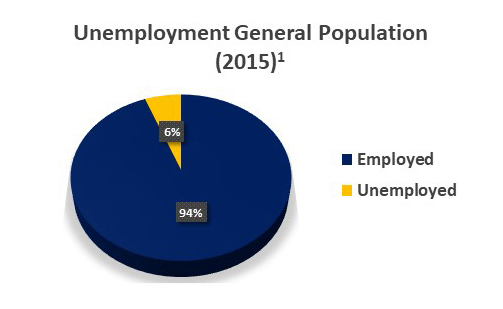
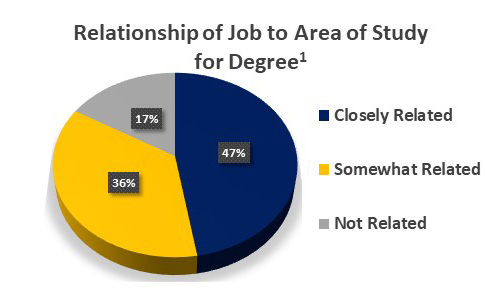
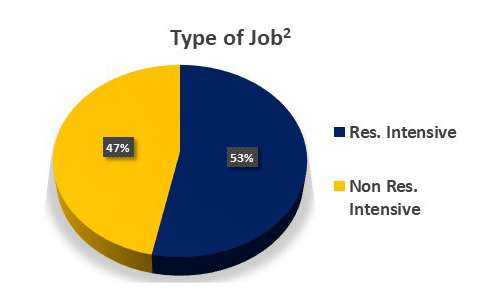
This graph illustrates the rate of unemployment for Science and Engineering Doctorates. As you can see above, Science and Engineering Doctorates are 97% employed with only a 3% unemployment rate.This graph in contrast to the first one, illustrates the Unemployment rate for the General Population, showing 94% employed vs. 6% unemployedThis graph shows the Relationship of Job to the Area of Study, with 47% being closely related to the Area of Study, 36% being somewhat related, and 17% not related to the Area of Study.This final chart shows the type of job, with 53% of jobs being Research Intensive, and 47% being Non-Research intensive.
1National Science Board. Science and Engineering Indicators 2018. NSB-2018-1 2Sinche et al. 2017. PLOSOne. doi.org/10.1371/journal.pone.0182023